Is it possible to tell the story of a squash match, or even an entire squash season, in a single infographic?
Squash IQ put this question to Jamie Abbott. He is one of three squash-playing friends looking to bring the statistical rigour used in other elite sports to the world of squash through their squash data start-up, Cross Court Analytics.
Counting US pro Amanda Sobhy (pictured above) and England Squash among its clients, the York-based company collects between 6,000 and 10,000 data points per match. This allows it to serve up golden nuggets on where pros are winning – or losing – their matches that might otherwise have been missed.
Founded during lockdown, Cross Court Analytics remains an evening and weekend pursuit for the York Squash Club trio.
For this reason, we found ourselves chatting to Abbott not during a working day but on a Sunday afternoon.
Chief among our questions for the approachable squash enthusiast was to what extent a single infographic can encapsulate the story of an entire match.
Abbott went one better in his reply, telling us that the drama of the entire men’s 2021-22 season – when the crown was passed from Mohamed Elshorbagy to Ali Farag, and then from Farag to Paul Coll, before finally settling on the head of Mostafa Asal – could be boiled down to just three visual graphics…
Chart 1: How Farag dethroned Elshorbagy
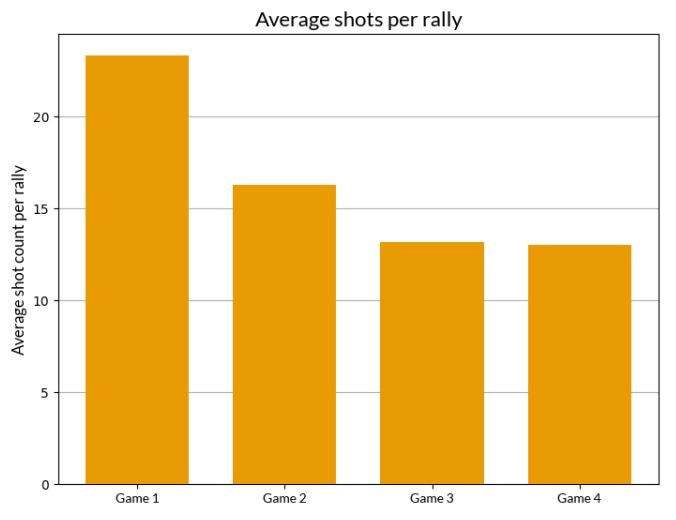
Although Mohamed Elshorbagy began the 2021-22 season as world number one, Farag had wrested top spot from The Beast by October.
“Elshorbagy passing the baton to Farag was really revealed with the rally length data,” Abbott said.
“If you look at the 2021 World Championship final, Elshorbagy took the first game but Farag reeled him in and Elshorbagy seemed to completely run out of steam. This was something we’d seen earlier in the season against Asal in the World Tour finals, and rally length is a really nice indication of this.”

In the World Championship final, the average rally length in the first game was 25 shots – well up on the men’s tour average of 15-16 shots, Abbott explained. But by game 4, this figure had halved to 12-13 shots (the World Tour finals match with Asal followed a similar pattern, with average rally lengths halving from 17 shots in game 1, to between 8 and 9 shots in game 4).
“In line with that was a spike in unforced errors from Elshorbagy, as he sought to cut rallies short,” Abbott added.
Chart 2: How Coll overhauled Farag
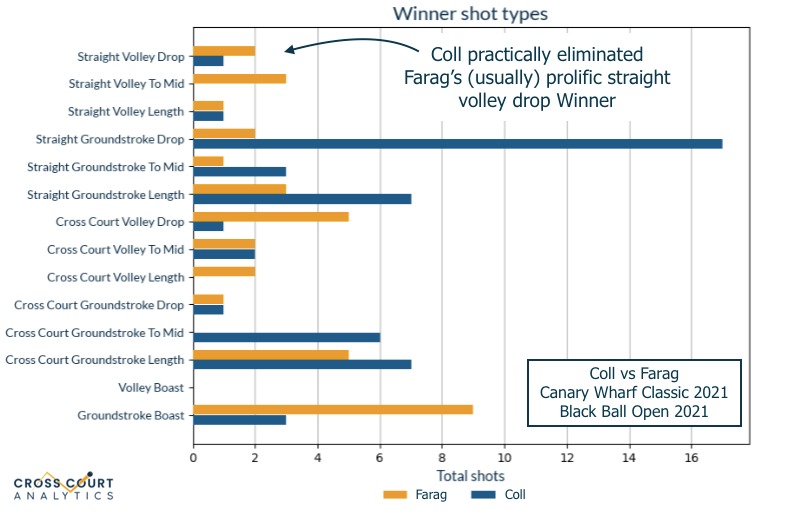
If Farag’s usurping of Elshorbagy represented phase one of the season, phase two saw a second shift at the top as Paul Coll came to the fore.
The New Zealander’s rise to world number one in March 2022 was set up by two key games against Farag at the end of 2021. In them, Coll used height to thwart his Egyptian rival’s backhand volley drop, according to Abbott.
“Coll wrested the mantle from Farag, and we really saw this towards the end of 2021 when Farag played Coll in Canary Wharf and Black Ball,” he said.
“It was Coll’s lifting game that really underpinned the change of circumstance.

“Typically, players were lifting 5% of their shots against Farag. When Coll played Farag towards the end of 2021 and beginning of 2022, he was lifting 15% of shots.
“And that meant that Farag found it harder to hit volley-drop winners. At Canary Wharf and Black Ball, 1 in 7 of Farag’s winners were volley drops, but when he took on Coll in these tournaments, only 2 of his 36 winners were volley drops.
“Coll had found a way to remove an element of Farag’s attacking game.”
Coll went onto beat Farag again in the final of the British Open in April 2022 by using a different tactic (which Cross Court Anatlyics covered in a separate blog here).
Chart 3: How Asal usurped Coll
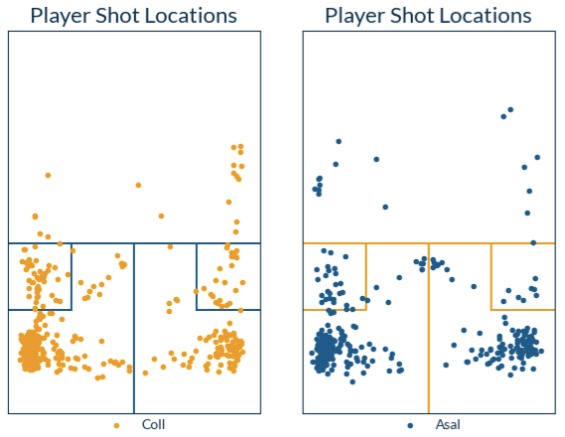
By the summer of 2022, a new top dog had emerged in the large form of Mostafa Asal.
Although the young Egyptian didn’t hit world number one until January 2023, he laid the groundwork with pivotal wins in the summer of 2022 at El Gouna and the World Tour Finals.
Cross Court Analytics’ data suggests that Coll became too passive against Asal when the two met at El Gouna. The Kiwi took the Egyptian short just once every 40 shots.
“That’s really, really passive,” Abbott explained.
“Coll’s lifting game had served him well against Farag, but it just wasn’t good enough against Asal.

“Asal could just stroll around the back of the court knowing that Coll was never going to take it short. Coll had clearly decided to bring his fitness to the fore – as well he should – but even if you do that you have to be slightly proactive to keep your opponent switched on.”
Coll was also undone by Asal’s scrambling ability, an underrated facet of his game, Abbott added.
“We talk about Farag and Diego Elias’ movement and Coll and Joel Makin’s stamina, but Asal is a serious scrambler when he needs to be,” he said.
“One of the metrics we have that highlights this, is that for every two outright winners that Asal’s opponents hit against him, he makes one forced error. This is second in the top ten only to Tarek Momen.”
Lightbulb moment

Cross Court Analytics’ vision of telling stories with data was inspired by other sports, with the lightbulb moment coming during Covid.
Abbott had been a keen cricket player before turning to squash, and was fascinated by the data analysis provided as a matter of course by cricket and football broadcasters.
“Some of the players we’re working with – like Amanda Sobhy and Aly Abu Eleinen – have picked up on the fact that if you watch other sports you have this data as a matter of course. And we’re really keen to be in that position for squash as well,” he explained.
“[The idea] was forced upon us by Covid. James [Brunton], Michael [Abbotson] and I used to play 4-5 times a week at the same club in York. But then we couldn’t play at all, so we switched our attentions to this,” he explained.
“The three of us had different strengths we could bring to the party. I was doing a lot of statistical analysis in my Masters at the time and had the interest in other sports.
“James is a software developer, so he could help run analysis at speed and accurately and help us log the matches.
“And Michael is really our business brains. He’s the one who ties it all together. He said ‘if we’re going to do this, let’s do it properly and do it to the highest spec’.”
📈 The chart you’ve all been waiting for 👀💣
⬇️ Refereeing decisions per Game per player 👇 pic.twitter.com/Fvwa6TZBuW
— Cross Court Analytics (@xcourtanalytics) February 13, 2023
The trio lean on a team of seven data loggers, however (all of the data is collected manually).
They collect a range of different metrics on every shot, including the width and depth of the shot location, whether it was a ground stroke, volley or boast, and whether it was hit straight or cross court. Winners and errors are also tracked. Additionally, the trio caused a stir recently when they released data on the number of decisions in each of the top men’s games (see tweet, above).
“There are judgement calls. But when we take loggers on to record the data, they go through a rigorous process to ensure what they’re logging is up to the standards we require. But there is certainly a bit of subjectivity to it, no matter how rigid your definitions,” Abbott said.

Although Cross Court Analytics has collected about 500,000 data points from 60 matches played by world number one Nouran Gohar, its data is just a sample – and not a very representative sample in the case of players outside the top 16, Abbott stressed.
Still, its visually pleasing infographics are giving players, coaches and fans alike fresh insight into the top players and how they are winning or losing their matches.
Momen’s back-to-front squash crystalised
Sometimes, the data crystalises what is already known.
Just occasionally, however, it exposes tactics or narratives that noone – perhaps not even the players themselves – are fully aware of.
A case in point is the drop shots hit by Egypt’s Tarek Momen (pictured below), known for his ‘back-to-front’ style squash.

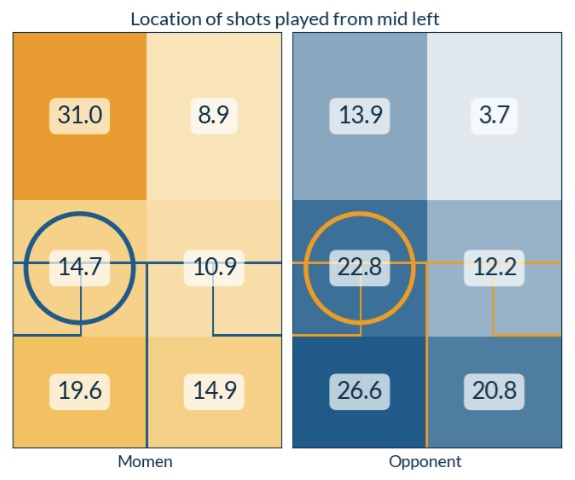
“Probably the best example of the data revealing something that was certainly new to me, and perhaps to viewers of the game, was when we looked at Momen hitting the ball short,” Abbott explained.
“It’s well known that Momen takes the ball short a lot. But when we analysed it, although we found that he does hit it short a lot – about 1 in every 6 or 7 shots – that’s no more than Elias or Farag.
“That’s interesting of itself. But what distinguishes Momen is where he hits his drop shots from.
“He hits about the same number of drop shots from deep left, deep right, front left and front right as other players in the top 10. But when it comes to hitting drops from the mid left, he’s playing a completely different game from everyone else. He hits 40% of his drop shots from mid-left – and nobody else gets above 25%.
“Momen is the only player to hit a higher percentage of drops from the mid court than on the counter drop.
“The data confirmed what we already knew, but it also added a new angle to it. It really is a case of Momen taking the ball short as opposed to keeping it short.”
Kennedy and Perry compared
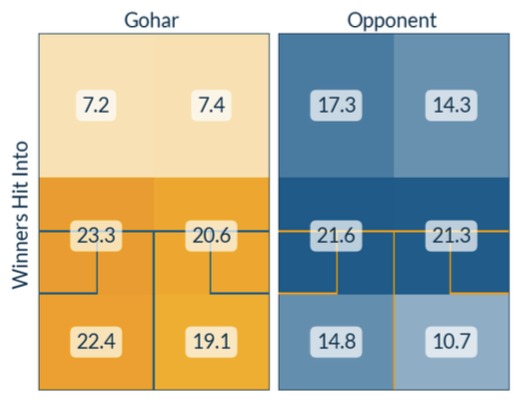
The pros Abbott and his team work with are usually most interested in the location from which their opponents hit their winners and errors.
Sarah-Jane Perry may seem like a more attacking player than her countrywoman Gina Kennedy, but the latter is much more likely to counter-drop, Cross Court Analytics’ data reveals.
While Kennedy counter drops 1 of every 3 shots from the front left, the figure is just 1 in 7 for Perry.
“A nice way to tell them apart is their counter drop options. Perry (pictured below) hits winners from all areas of the court, but Kennedy hits over 50% of her winners with drop shots,” Abbott said.
“Where players are hitting winners from and to is really crucial to many players,” Abbott said.

“In terms of different players and rally patterns, we love comparing Joel Makin and Youssef Ibrahim. Makin is an attritional right hander and Ibrahim is a really aggressive left hander (the data shows he counter-drops in the front-left an incredible 50% of the time), and those contrasting hands and styles play really nicely for our charts.”
“The other broad area of data that clients are really interested in is the winner-to-error ratio,” Abbott continued.
“Gohar and Nour El Sherbini have dominated the women’s game since Covid and Raneem El Welily retired. They’ve traded places at the top and won pretty much everything, along with Hania El Hammamy.
“Their winners and errors are a nice case study. Sherbini hits about 7 winners per game and 2.25 errors. Gohar on the other hand hits 6 winners per game but also fewer errors, at about 1.4.
“Put a different way, Sherbini hits more winners than anyone else on tour, but the same number of errors as the chasing pack. Gohar hits the same number of winners as most players, but is a standout performer when it comes to lack of errors. These two have dominated [recent times], but with slightly different conventions around winners and errors, which is a nice take (a full match report on Sherbini and Gohar’s 2021 World Championship Final match can be found here).”
Future plans
Cross Court Analytics continues to enlist more pros, with Harvard-based Egyptian world number 34 Aly About Eleinen the latest to ink a partnership.
Looking forward to working with @xcourtanalytics this season! Really excited to add a new perspective to my game https://t.co/QvP1uvQIwR
— Aly Abou Eleinen (@AEleinen) February 1, 2023
It is also working with several national federations, including in England, Scotland and France.
But a permanent relationship with the PSA remains elusive, for now, Abbott conceded.
“We’re keen to work with more players and federations,” he said.
“We would love to work with the PSA as a matter of course. And I’d love to be able to collect data on every single PSA match that happens throughout the calendar. Our data so far is a sample. For some players, it’s a good sample but for others it’s not such a good sample.”
Abbott – who modestly dismisses his Squash Levels rating of around 3,500 points as “nothing outrageous” – is ultimately in this for the love of the game and spirit of adventure, however.
“Ultimately, it’s three squash-playing friends taking on a squash data adventure. It’s been a fabulous way to spend evenings and weekends ever since,” Abbott said.
For more information visit Cross Court Analytics.


